
PLATO-A plots for the last week
Welcome to the PLATO-A plots page. Here you can find many of the parameters that we monitor to make sure everything is running smoothly.
The page is divided into several categories: Instrument Module, Batteries, Solar power, Engine Module, Diesel engines, Current flow, Bus voltages, and Miscellaneous.
Click on any plot to enlarge it. In the image caption there are links to large versions of the plots in PNG format. Also in the caption you might notice the text (quick-link). If you bookmark or email this link, it provides a direct jump to the graph of interest.
All times are in UTC and the plots have a vertical black bar that indicates the time when the plot was generated. This bar lets you know how old the data are and when the last update occurred. The plots are updated regularly. The side bar has links to plots of different time intervals if you need a closer look at what is happening now, or want to see what happened in the past.
Instrument Module
The Instrument Module contains most of the scientific experiments, the 20kWHr LiFePO4 battery pack, the Iridium communications equipment, the Linux supervisor computers, and the solar panel power supplies. The plots below show some parameters relevant to these systems.
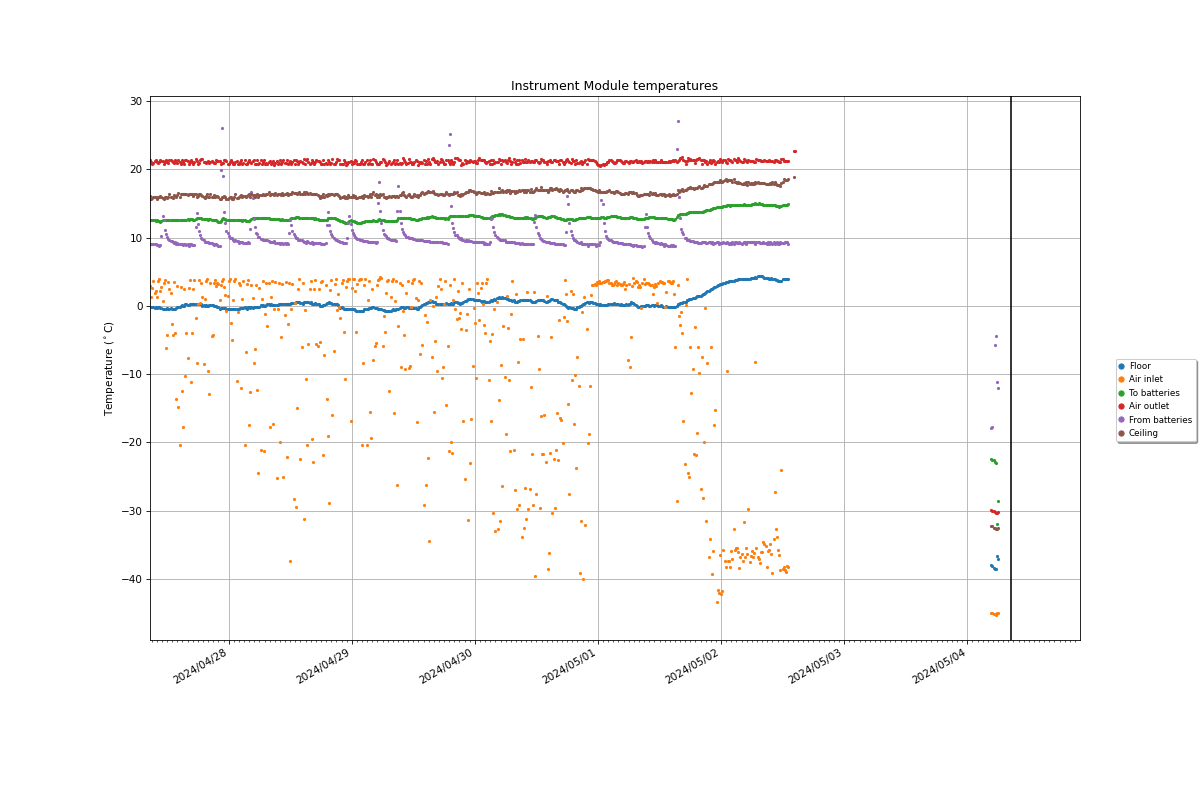
 The temperature of various pieces of electronic equipment in the Instrument Module. The hottest temperatures are usually the two computer CPUs. (PNG, Quick-Link)
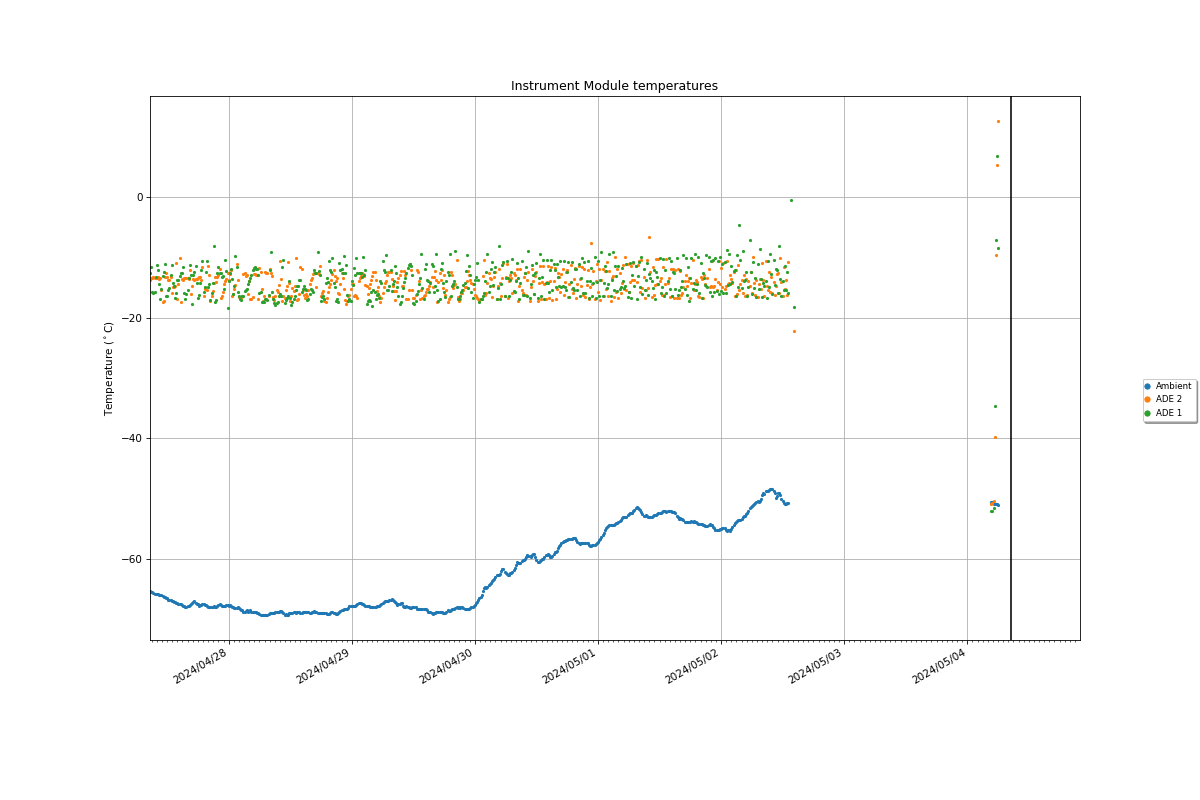
 The temperature of various pieces of electronic equipment in the Instrument Module. ADE are the "Above Deck Equipment" for the Iridium OpenPorts. They sit on top of the Instrument Module and are heated with resistors. "Ambient" is a sensor outside the Instrument Module, but is not a very good measurement of the true air temperature since it is affected by the sun, and may be covered in snow. (PNG, Quick-Link)
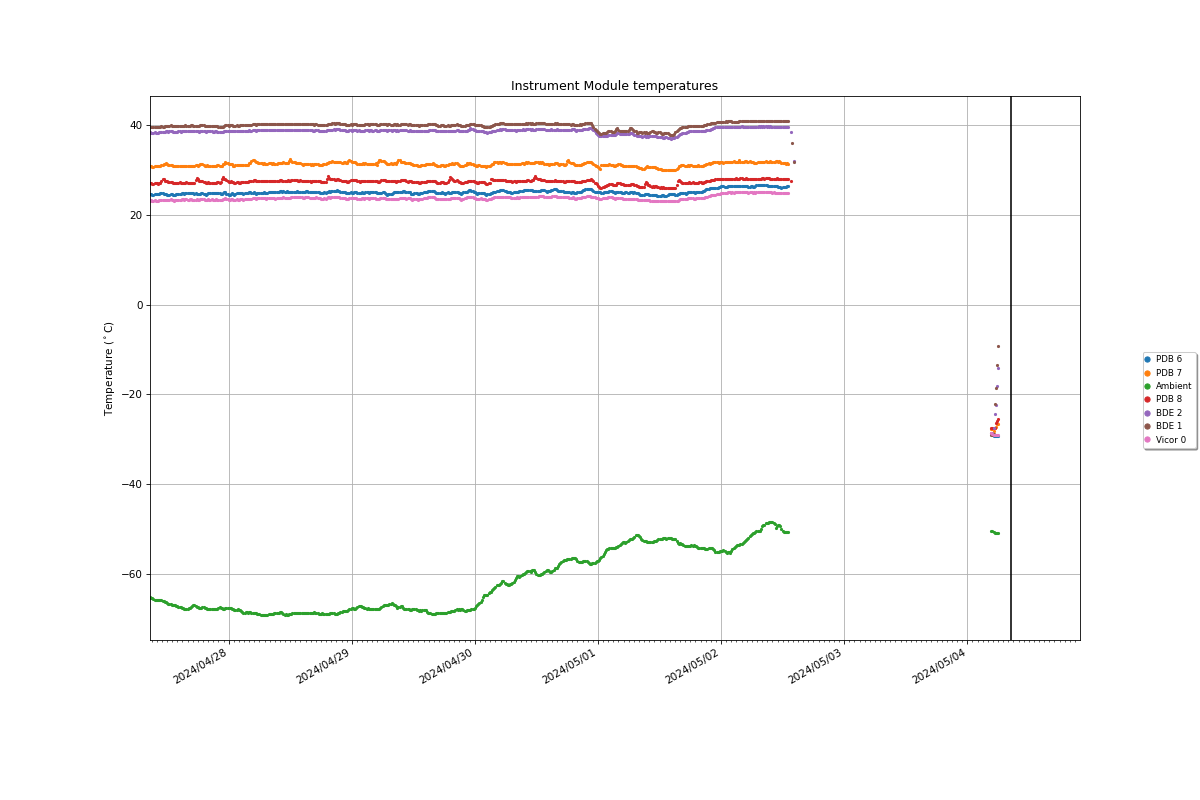
 The temperature of various pieces of electronic equipment in the Instrument Module. BDE are the "Below Deck Equipment" for the Iridium OpenPorts. "Ambient" is a sensor outside the Instrument Module, but is not a very good measurement of the true air temperature since it is affected by the sun, and may be covered in snow. PDBs are Power Distribution Boards, and the Vicors are DC-DC converters. (PNG, Quick-Link)

Batteries
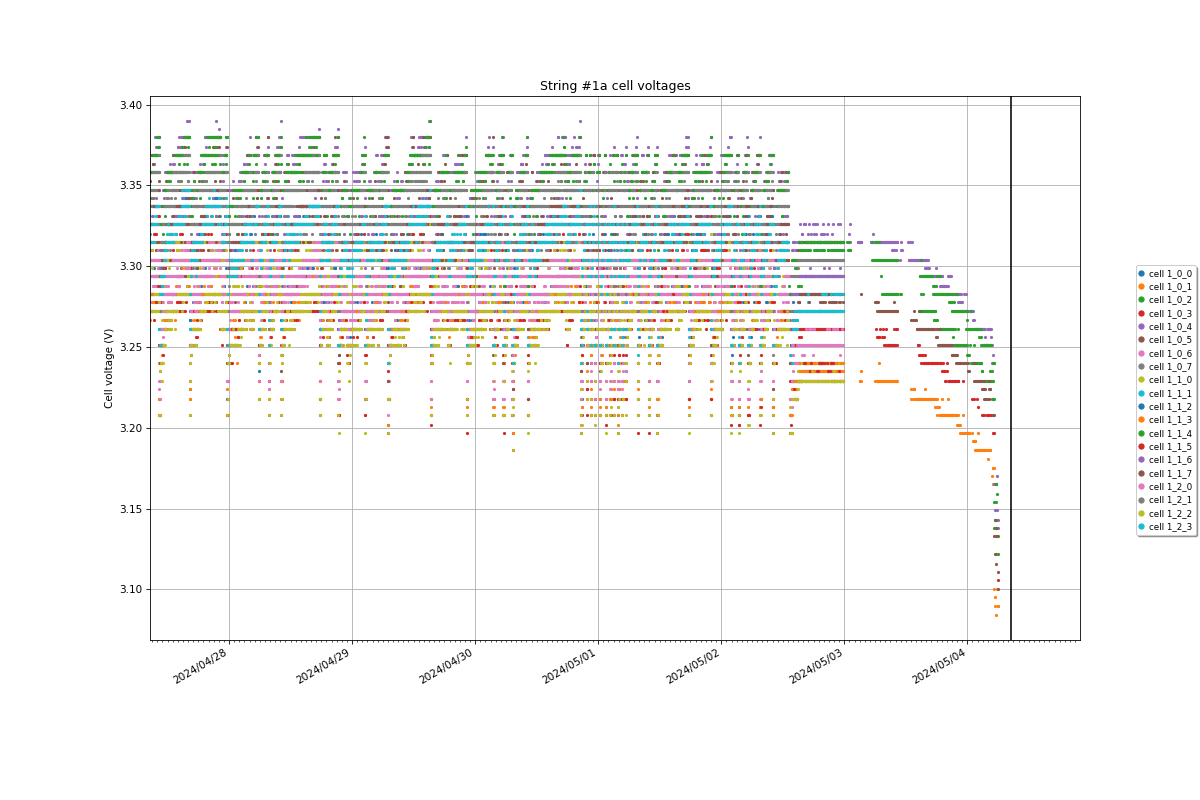
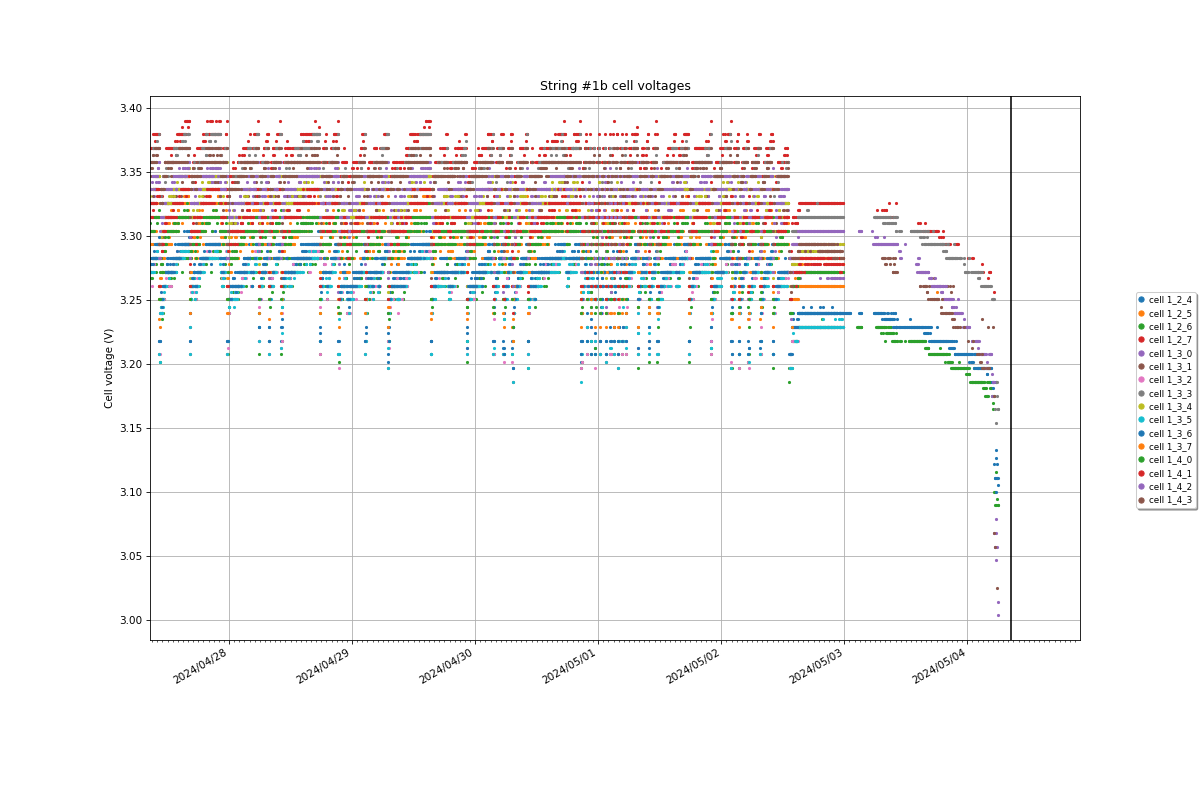
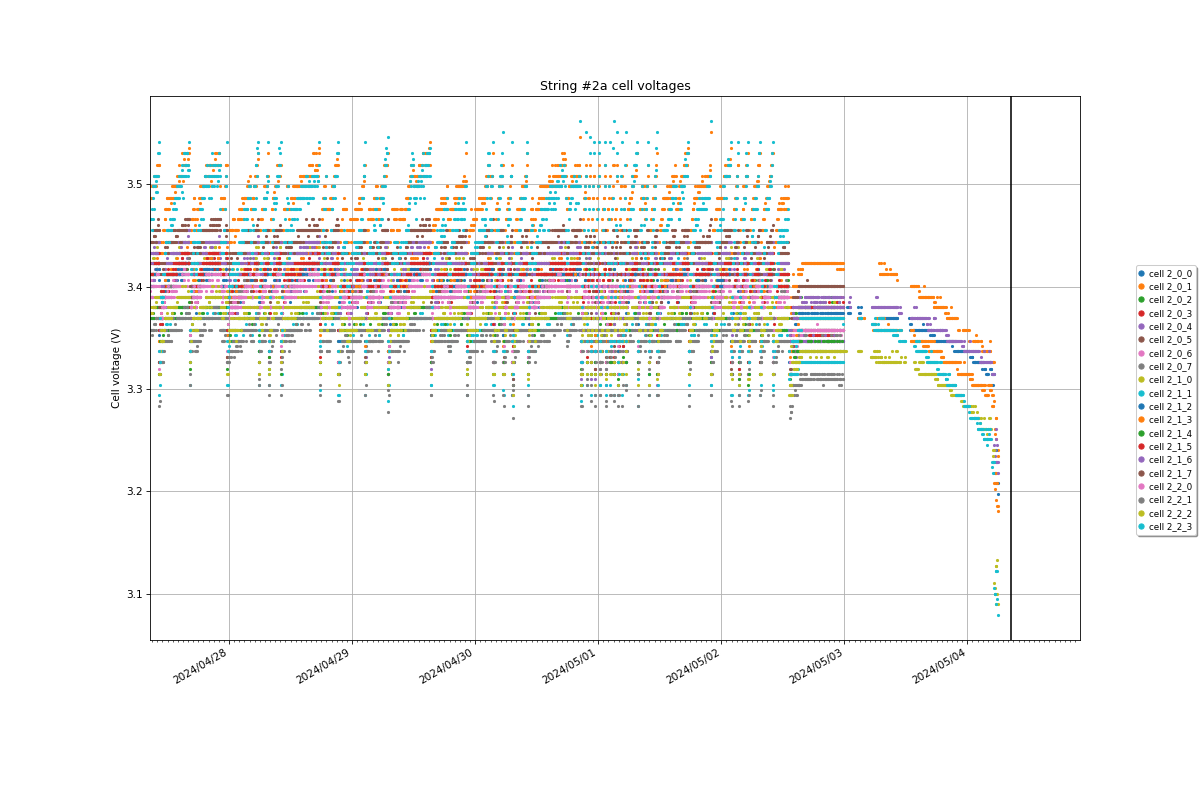
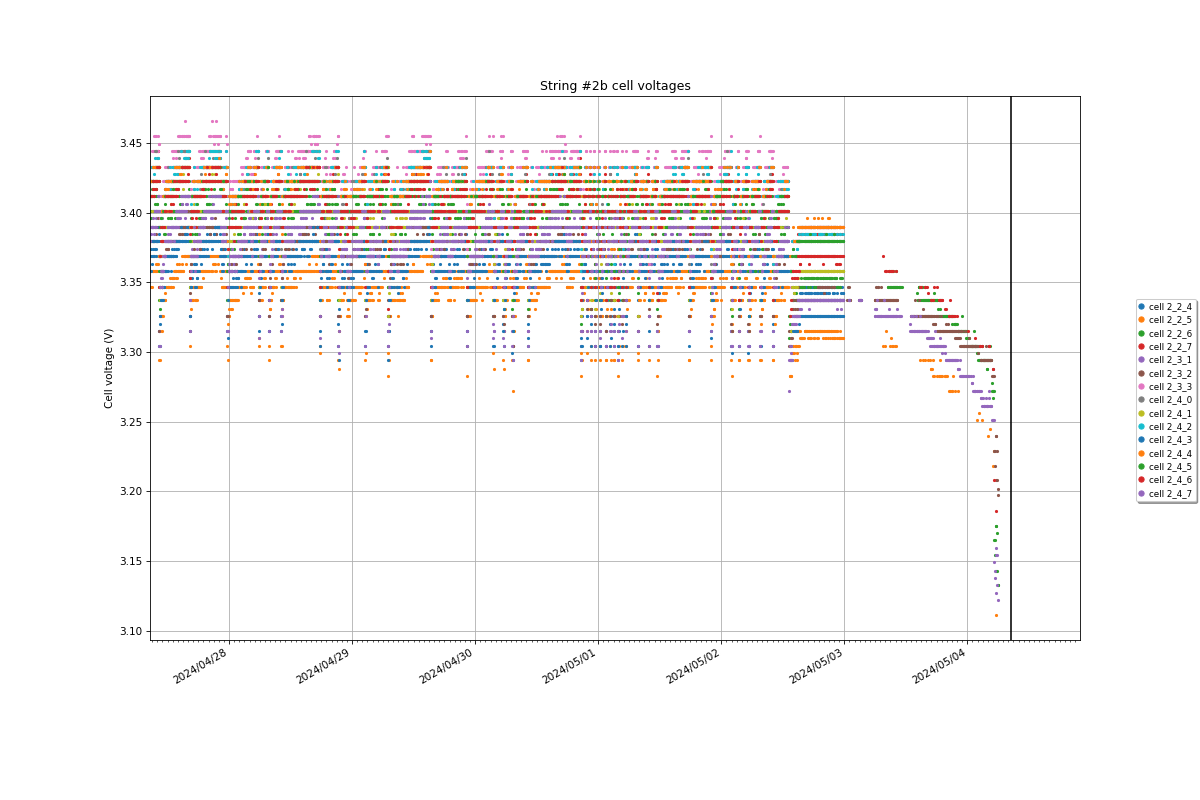
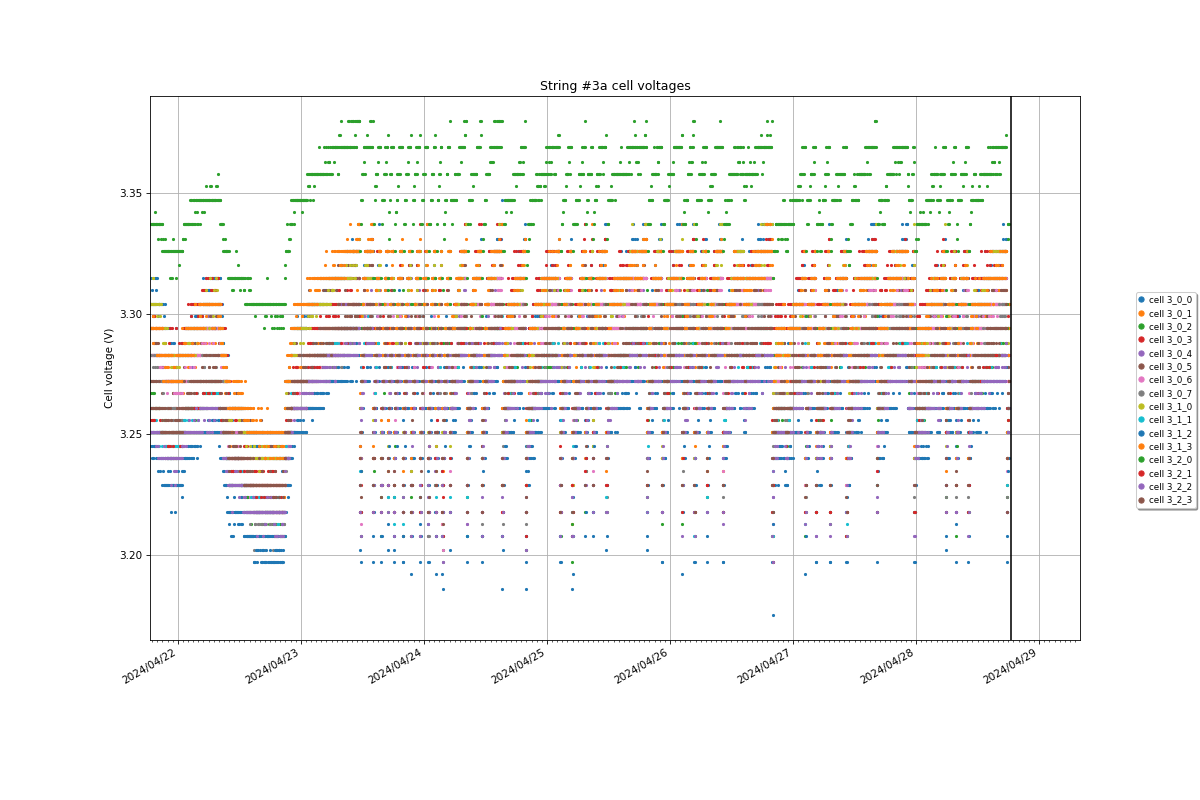
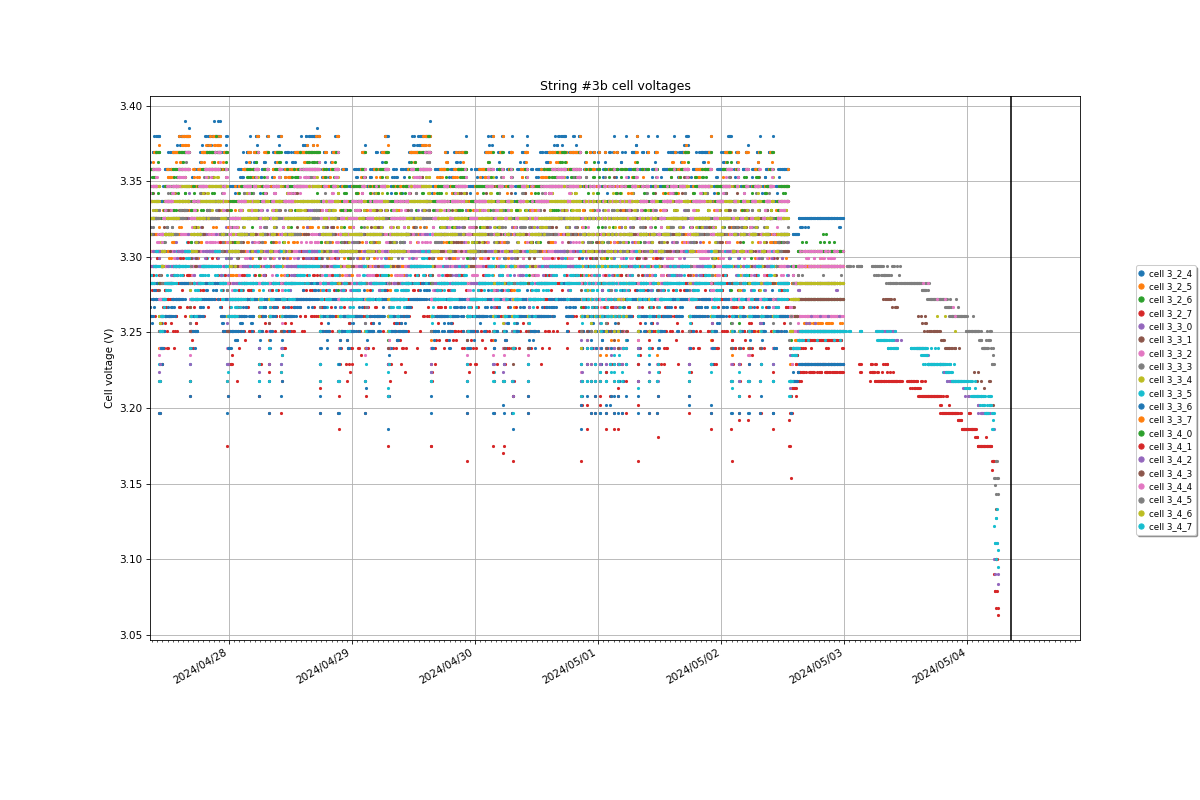
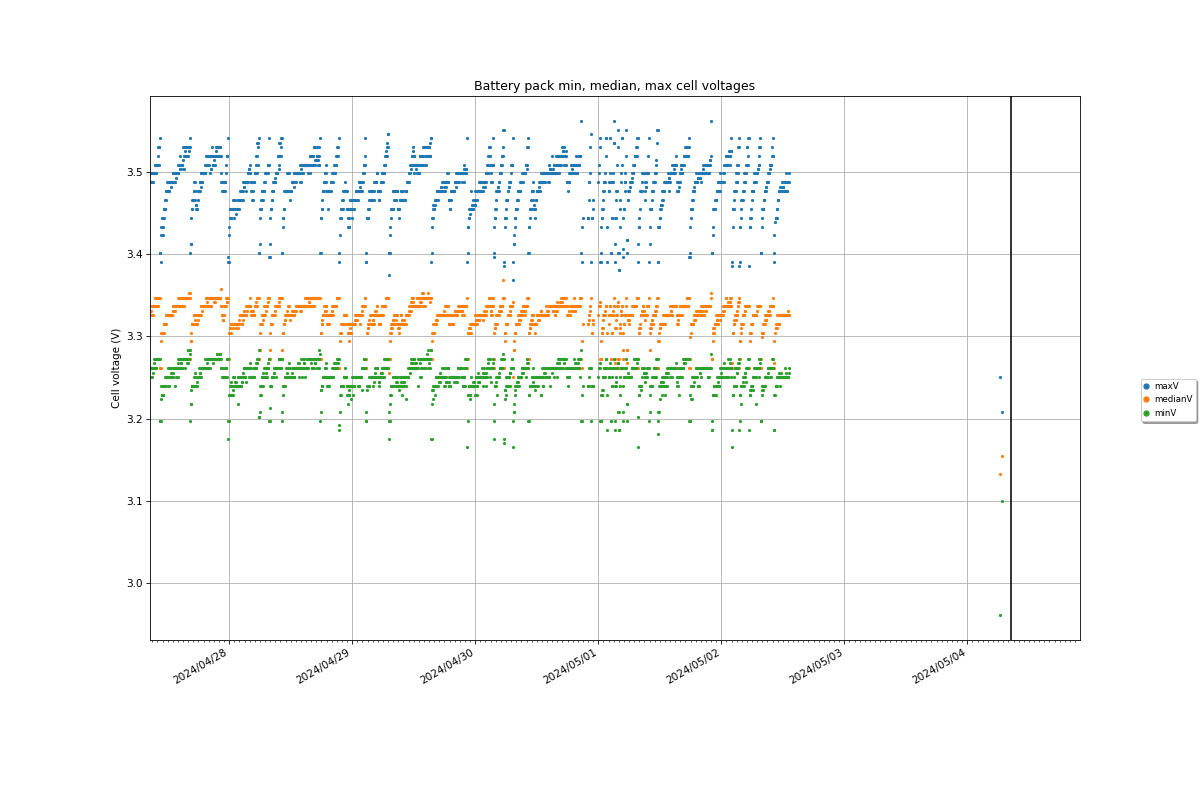
The plots below show the voltages, currents, and temperatures of the 20kWHr LiFePO4 battery pack. The batteries consist of three parallel "strings" of thirty-six 60Ah LiFePO4 cells. Each string is nominally 120VDC. Each cell is typically about 3.3V, and varies from 2.8V when almost completely discharged up to an absolute maximum allowed voltage of 4.25V. Once a cell is charged to about 3.4 volts, it rapidly increases in voltage if charging continues.
In the first six plots below, each string is divided into two groups of 20 cells (4 of the cells out of the 40 aren't present, and read as zero).
The three strings themselves are divided into 4.5 modules of 8 cells, with each module controlled by one "node".
During 2015, none of the nodes for String 1 were working, which explains why this string is missing from the plots below.


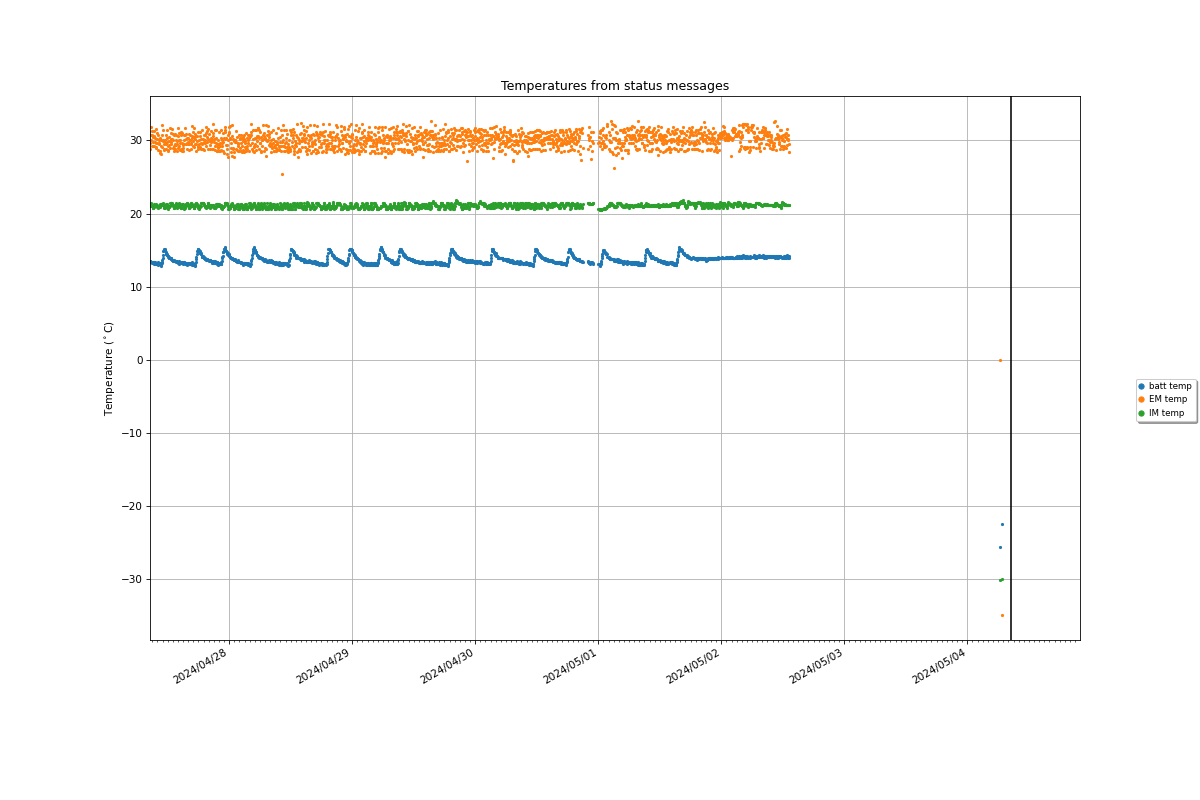
 The temperatures of the batteries, Instrument Module, and Engine Module, from the PLATO status messages. Note that the plots can appear to be double-valued, since the temperatures are derived by choosing between multiple sensors. (PNG, Quick-Link)
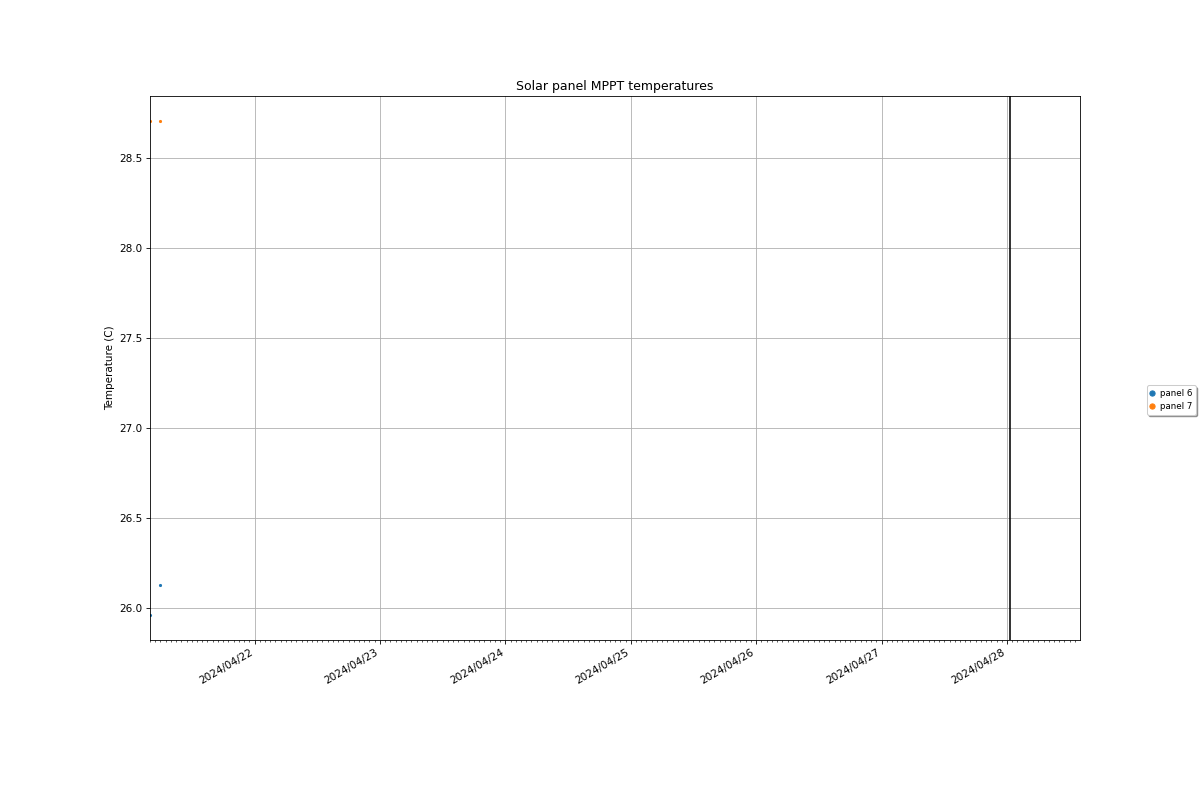
Solar power
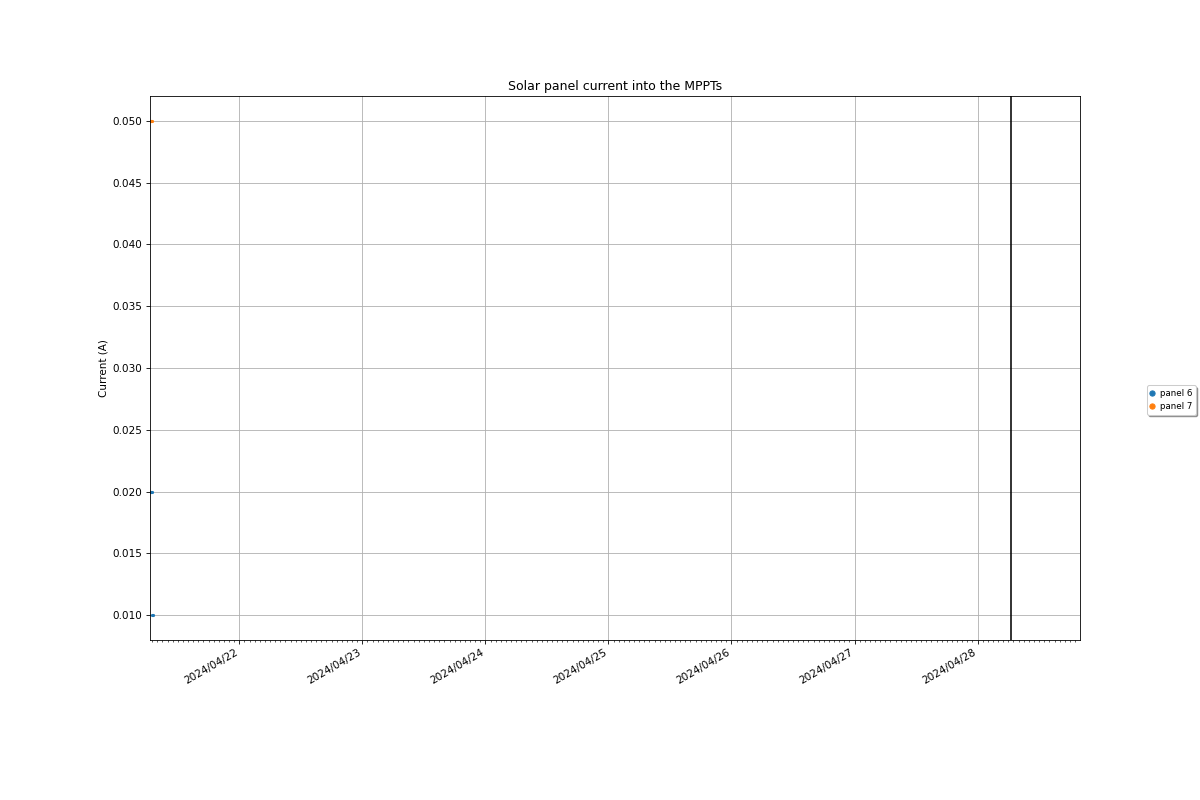
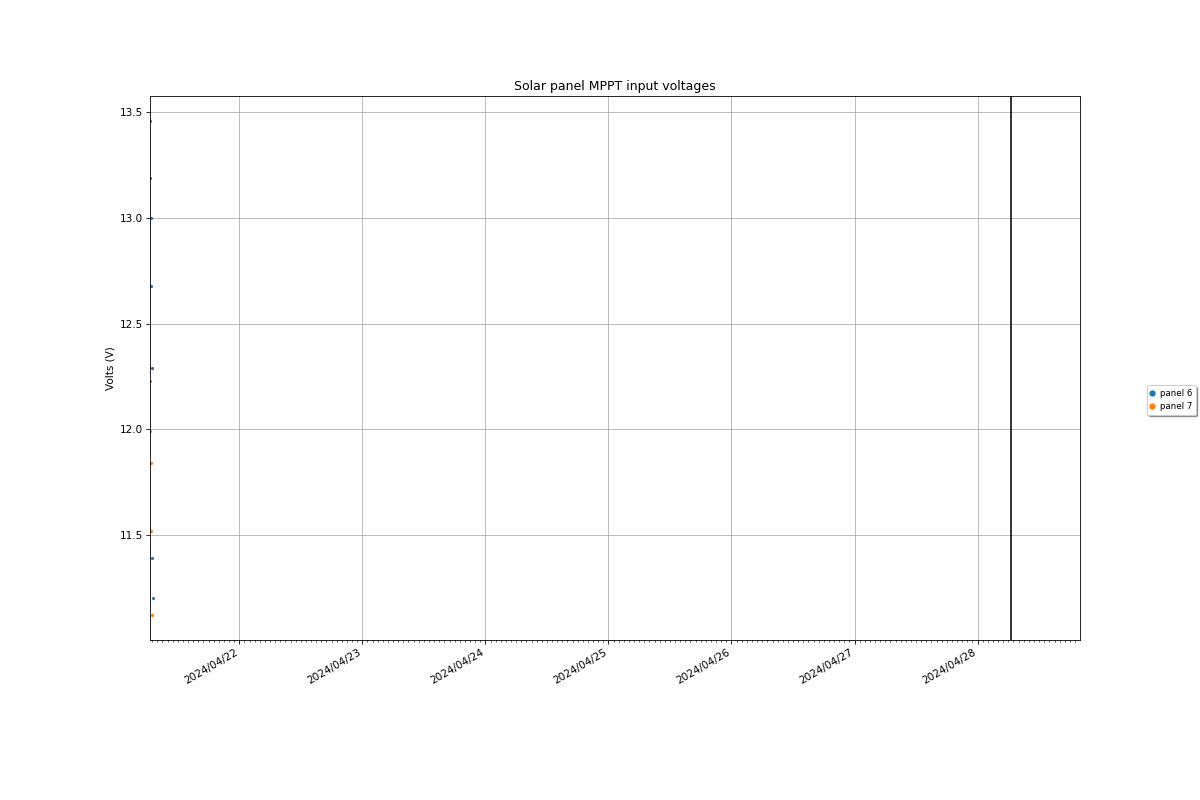
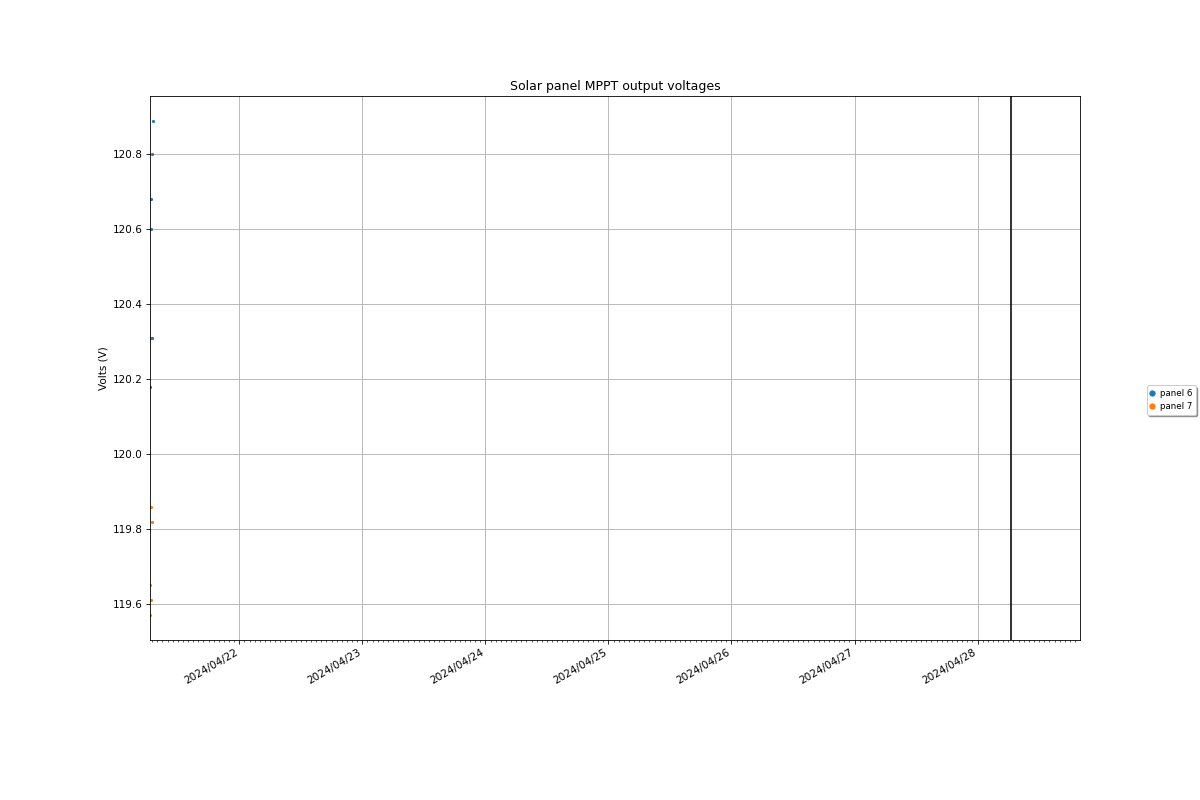
PLATO-A has four pairs of 195W solar panels. Each pair feeds into an individual Maximum Power-Point Tracker (MPPT). The plots below show various parameters associated with the solar power. Note that from 2015 the performance of the panels has been reduced by snow drifts that sometimes block the sunlight.
In January 2016, a new solar power system developed by Purple Mountain Observatory was installed. This has 10 panels configured in two strings of 5 panels each, and produces up to 2.5kW of power.
When the sun is down, the plots don't show any data.


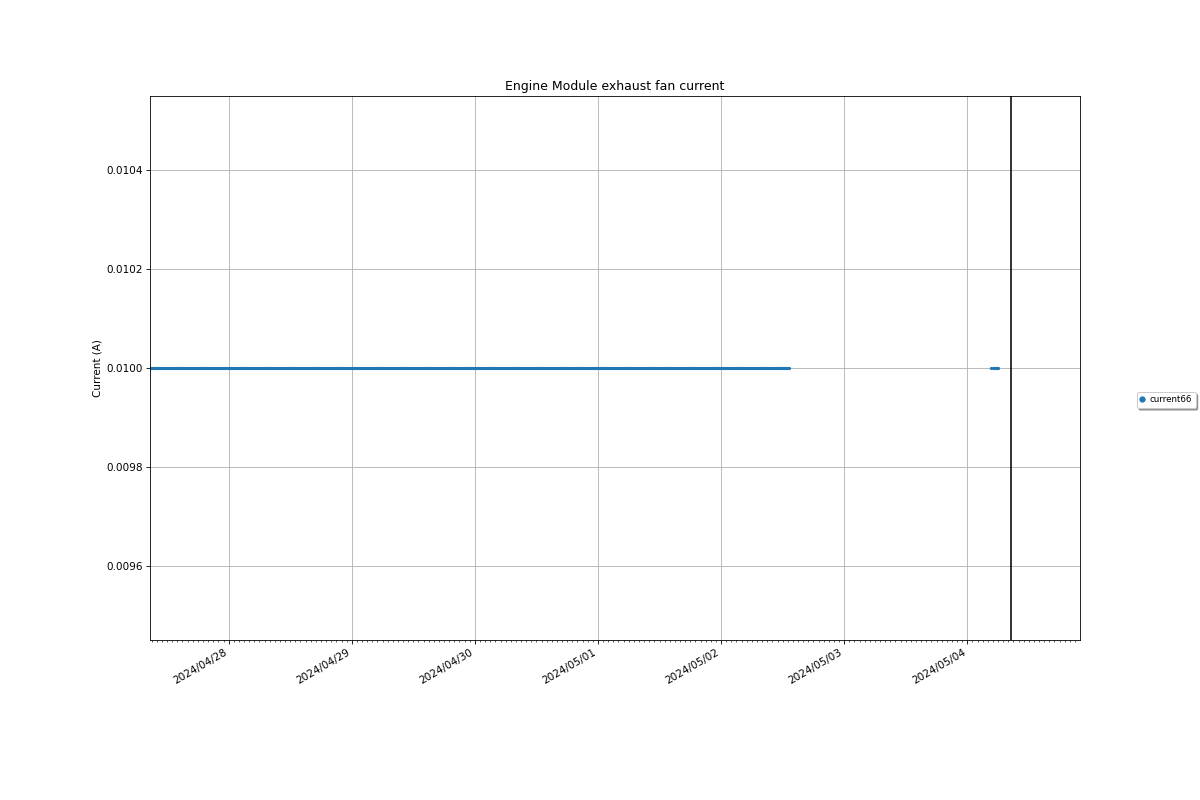
Engine Module
The PLATO-A Engine Module contains five Hatz 1B-30 diesel engines (as of January 2016 two of these engines are Hatz 1B-40 models), 6000 litres of kerosene, and various electronic control systems.
 The temperatures of the WaveSculptor digital signal processors. These temperatures should be close to the temperature of the metal plates that form the base of the engine modules. (PNG, Quick-Link)
Diesel engines
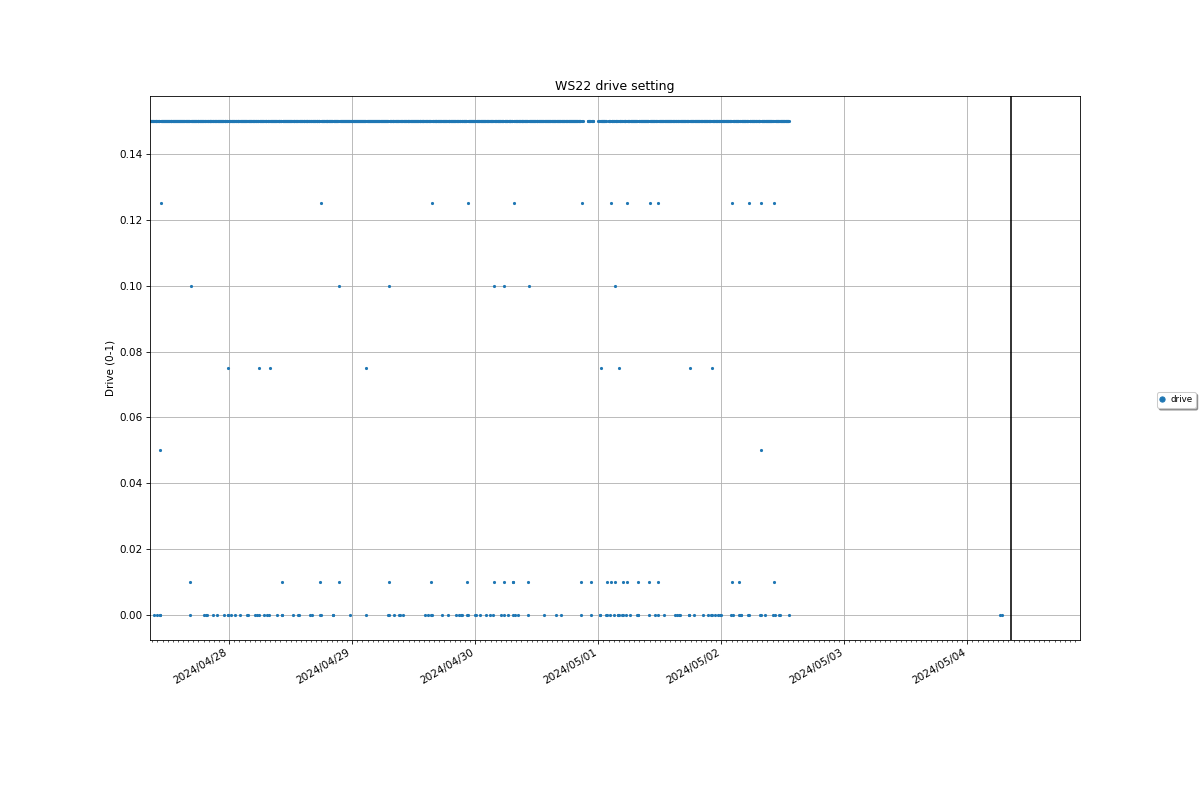
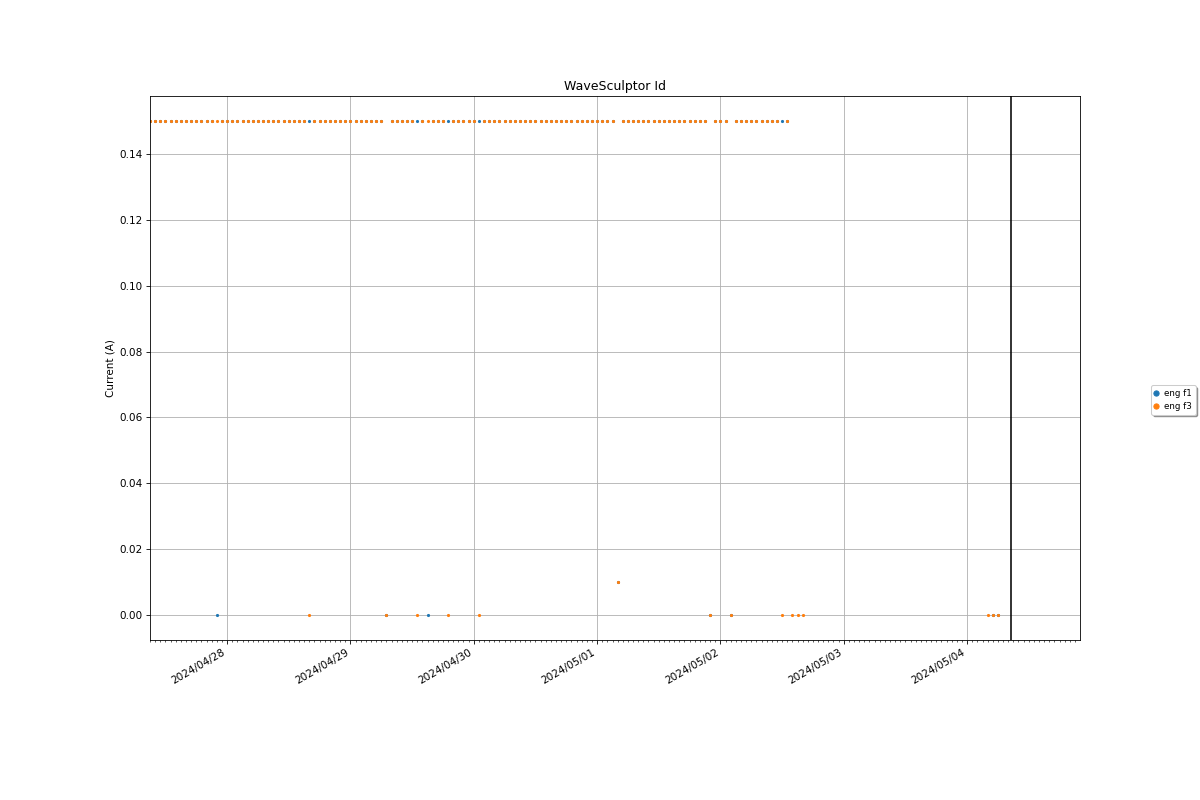
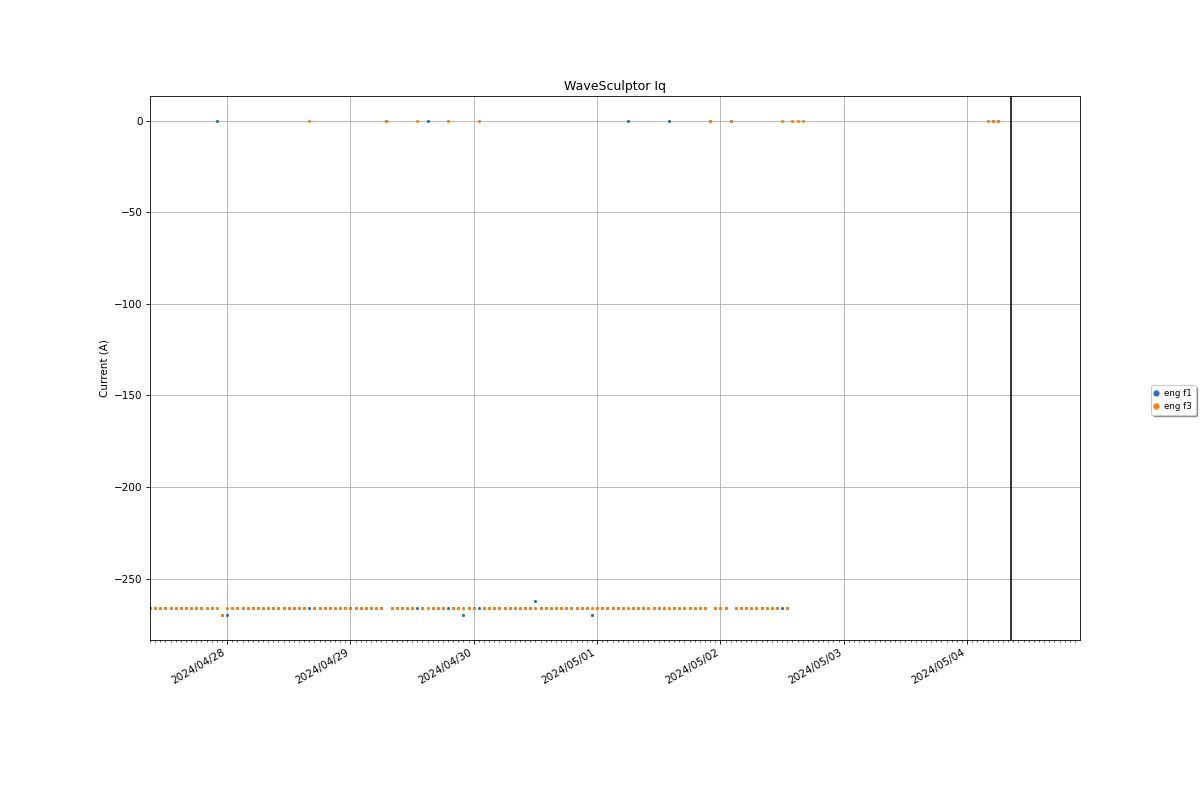
The five Hatz 1B-30 diesel engines in PLATO-A are connected to three-phase alternators with a capacity of about 1.5kW. Note: from January 2016 there are three 1B-30s and two 1B-40s in PLATO-A. The engines are controlled by Tritium WS22 WaveSculptors, which not only allow us to start the engines (by driving current into the alternators), but give us precise load control and diagnostics such as poutput voltage and current, and engine RPM.

 The WS22 drive setting, as a fraction of full power. This comes from the PLATO status messages. (PNG, Quick-Link)
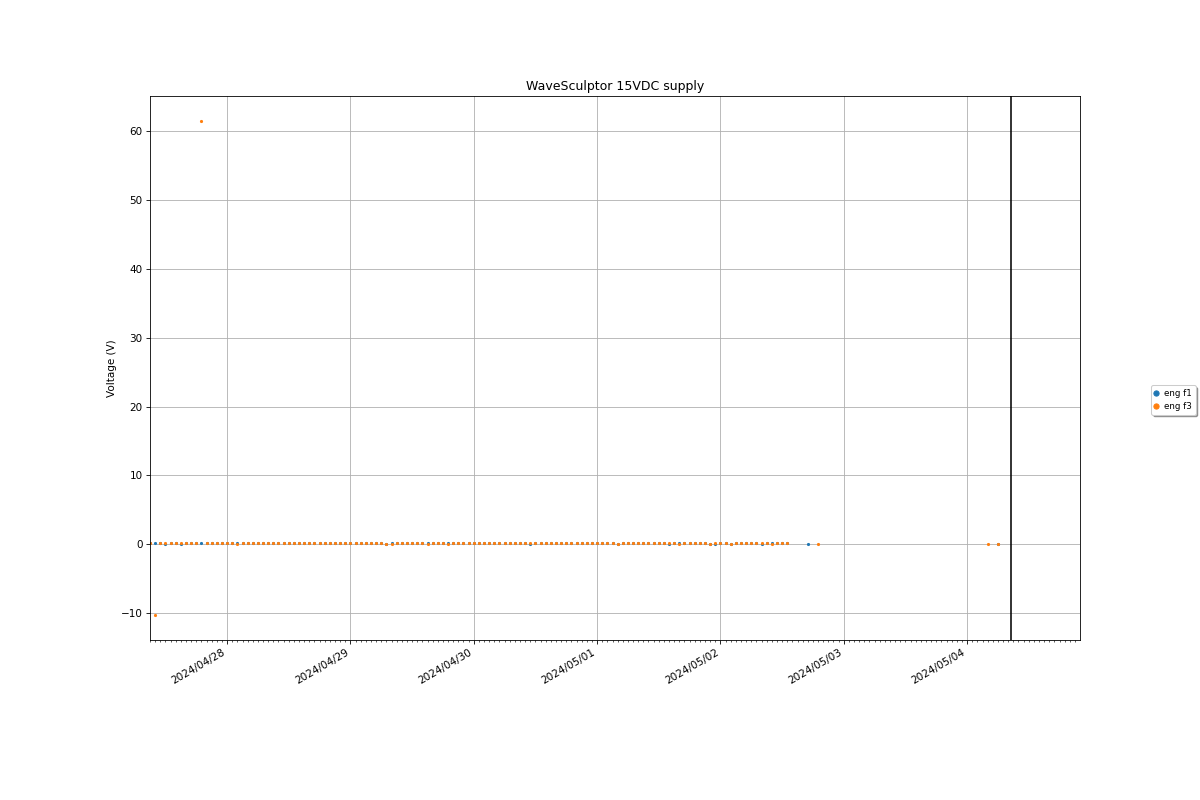
 The WaveSculptor 15VDC supply. This supply is generated internally within the WaveSculptor. (PNG, Quick-Link)
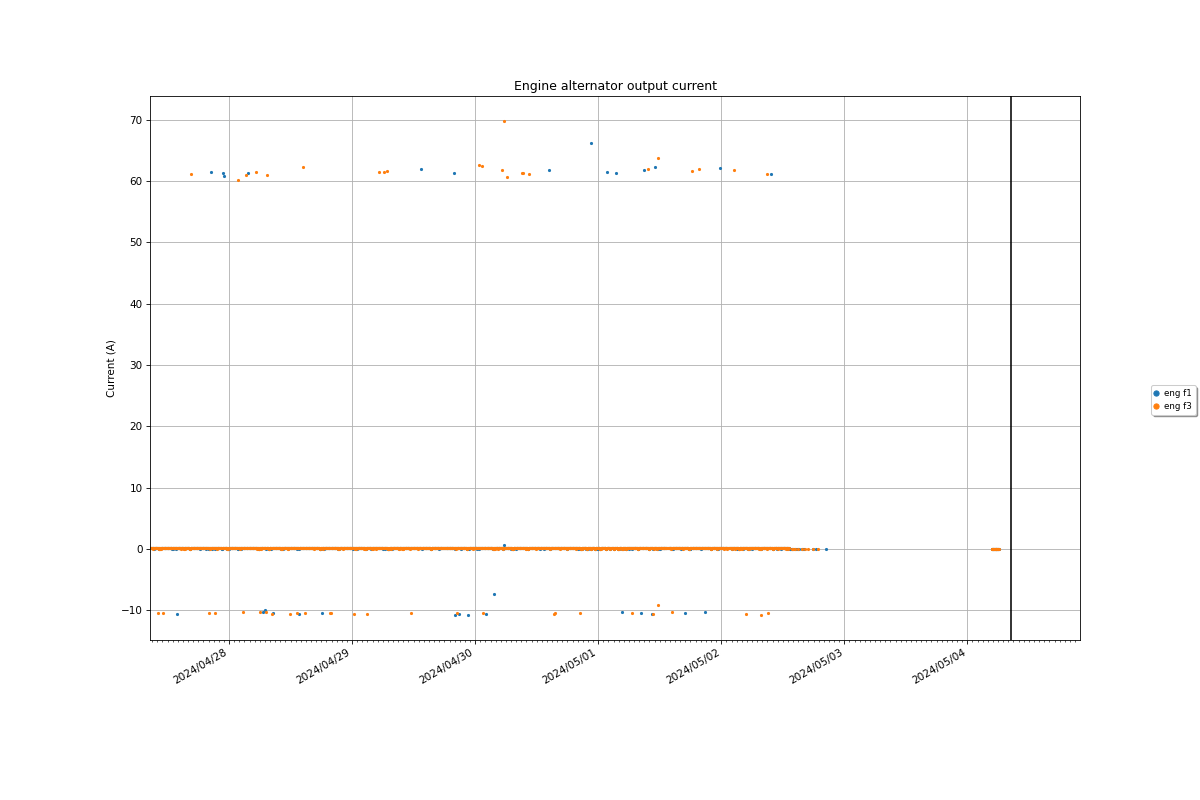
 The current provided to the alternators on the engines by the PLATO-R 120VDC bus. The current is negative when the engines are supplying power to the bus, and positive when the engines are being started. (PNG, Quick-Link)


Thermal management
The plots below show ...
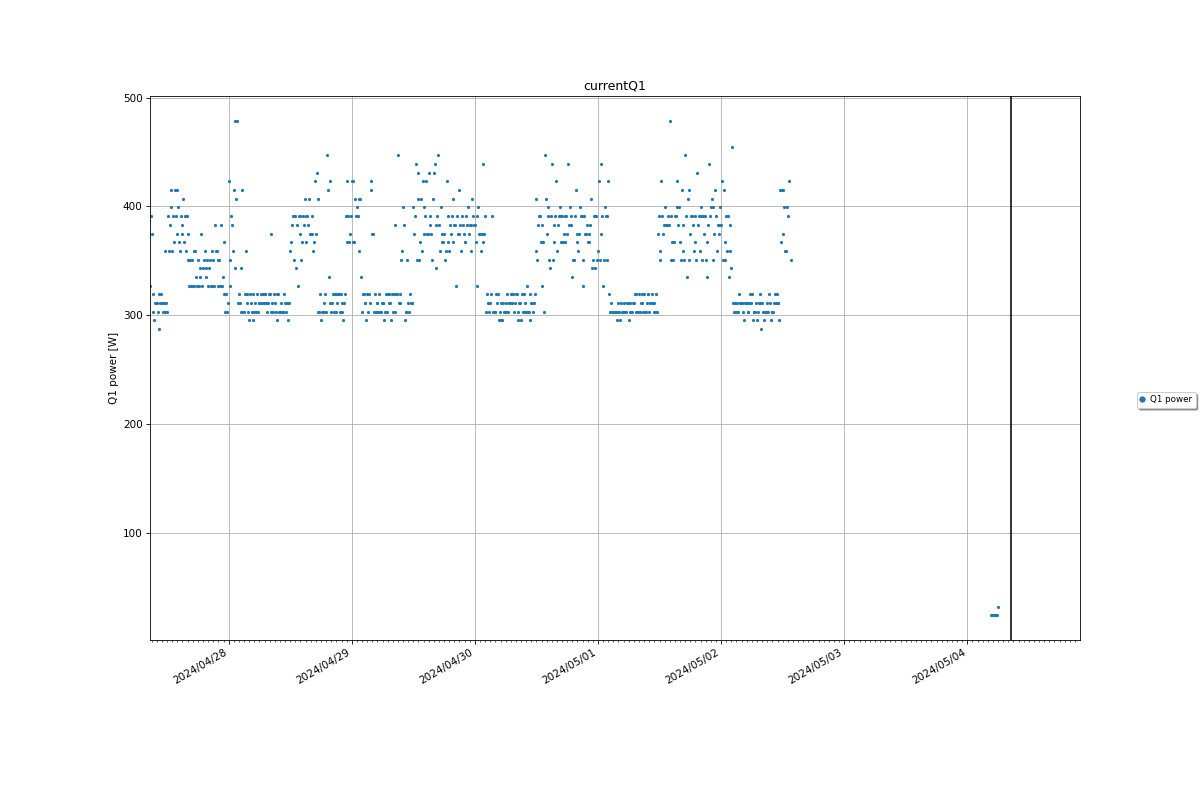
Current flow
The plots below show ...

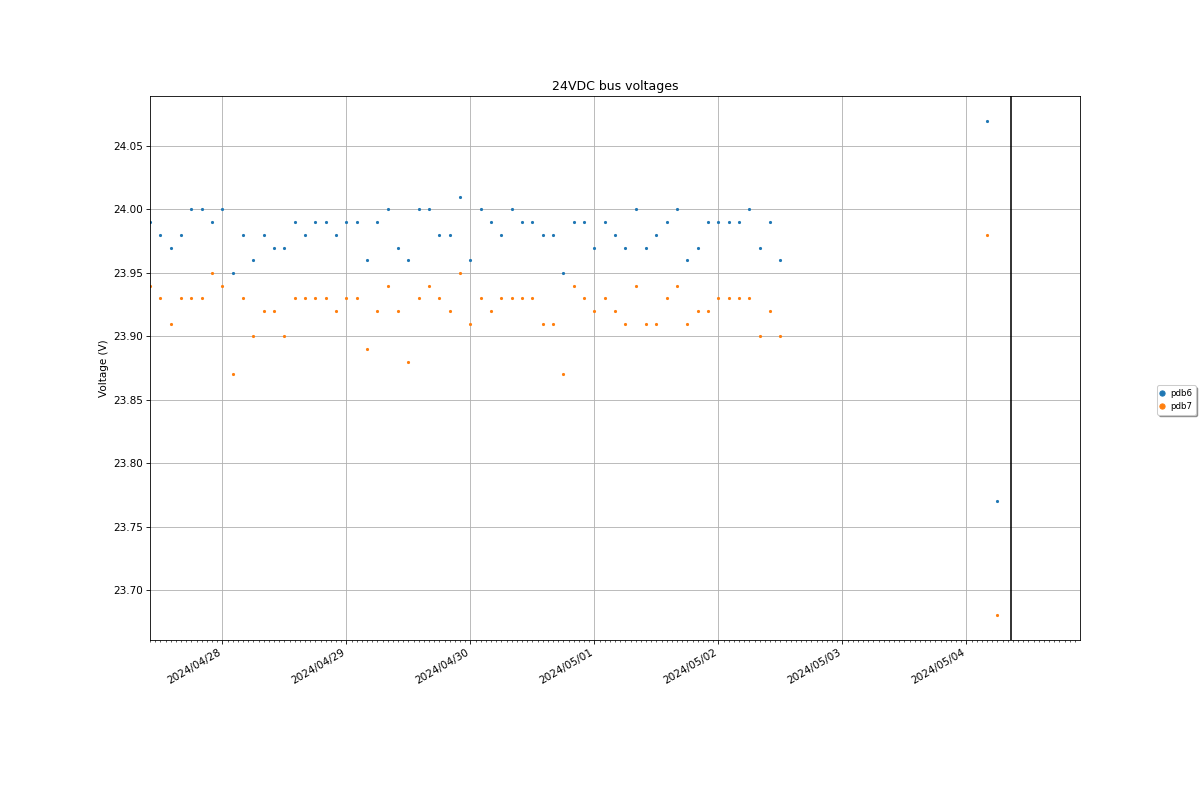
Bus voltages
The plots below show...

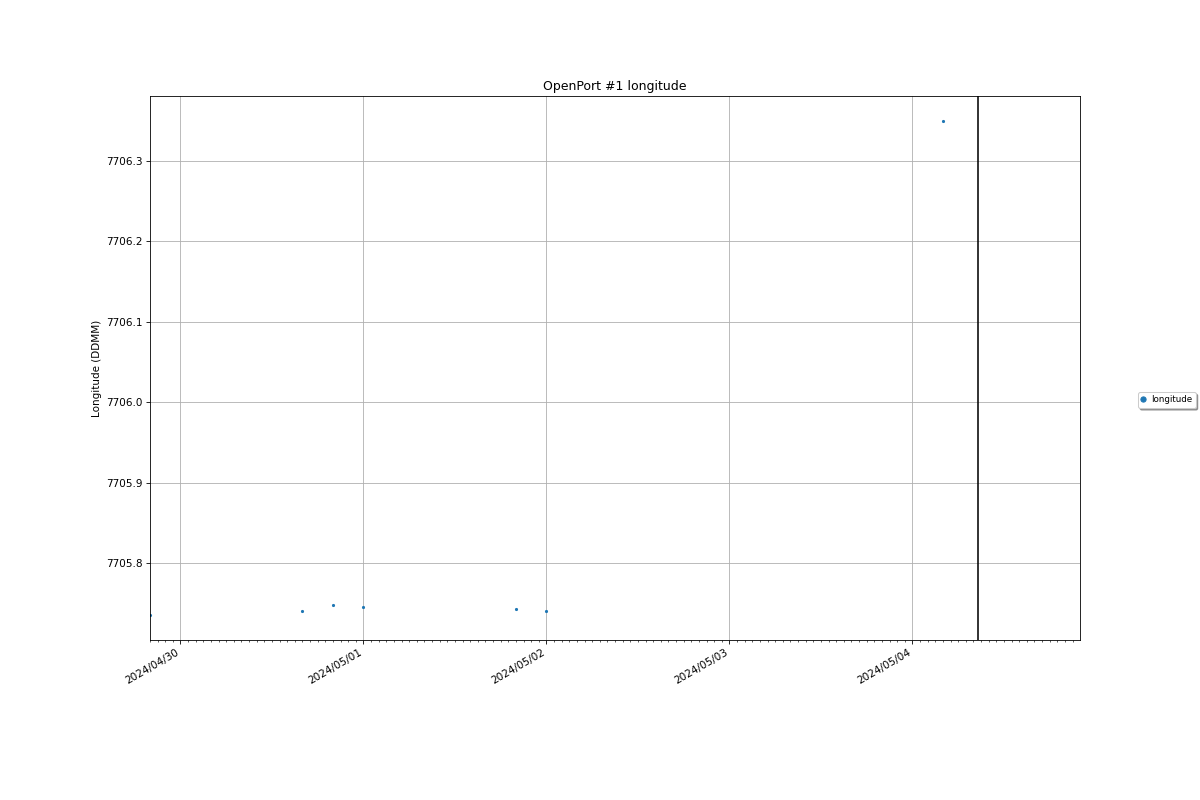
Miscellaneous
The plots below show various parameters from the Iridium OpenPort devices that are used to connect PLATO-A to the internet.
